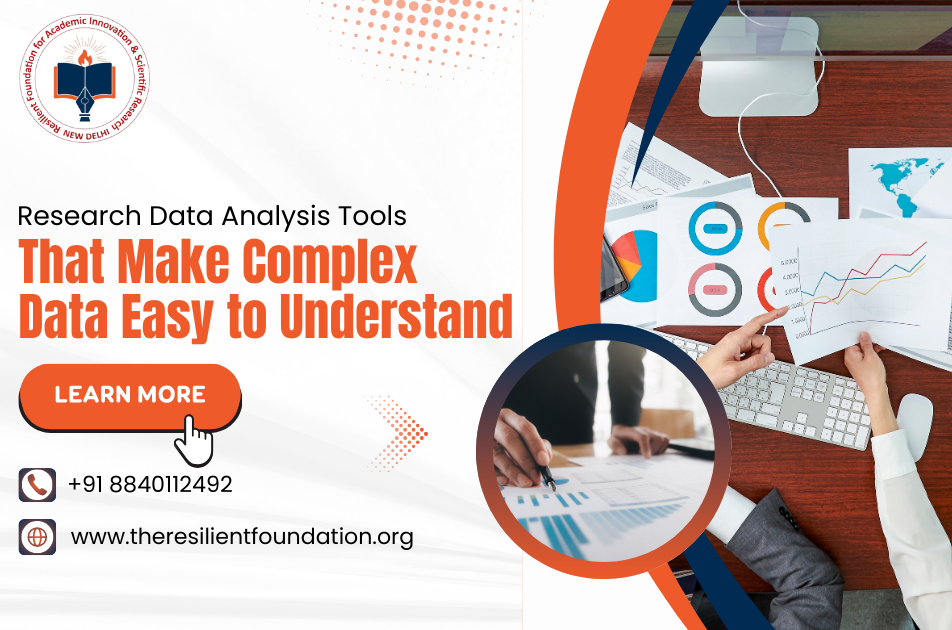
In today’s world, research projects create huge amounts of data. If we don’t use the right research data analysis tools, it becomes hard to make sense of it. But when we use effective methods, even the most complex results can become easy to understand. That is why many researchers now look for data science training for research to improve their skills. With the right knowledge and data visualisation training, researchers can present findings clearly. So, if you want to simplify your work, learning about quantitative data analysis training, data visualisation, and data analysis using SPSS and R is the best step forward.
Importance of Research Data Analysis Tools
Research data needs to be managed carefully, but without proper tools, you may lose time and accuracy. Research data analysis tools play a vital role because they help turn raw numbers into meaningful patterns. If you have data science training for research, you can handle challenges better. Let’s look at why these tools are important:
- They save time and reduce errors in results.
- Make data visualisation training effective by creating clear charts and graphs.
- They improve accuracy in quantitative data analysis training tasks.
- Support teamwork as results become easy to share.
- They allow better data analysis using SPSS and R for advanced research needs.
Because of that, using tools is not just an option—it is a necessity. Resilient Foundation supports learners with training programs that make these concepts easier to master.
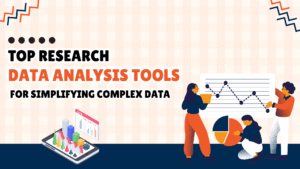
Top Research Data Analysis Tools for Simplifying Complex Data
When you start research, you may feel lost about which tool to pick. But the good news is that today, many research data analysis tools are available for different needs. If you also complete data science training for research, it becomes easy to use them. Below are the most popular choices:
- SPSS: Best for surveys and social science projects. It works well with data visualisation training and produces reliable reports.
- R Programming: Perfect for statistics and large datasets. It is used widely in quantitative data analysis training.
- Excel: Simple but powerful. It is still used for small projects and for data analysis using SPSS and R comparisons.
- Tableau & Power BI: Great for dashboards and charts. They make presentations easy for researchers after data visualisation training.
Therefore, choosing a tool depends on your project needs, but learning all of them can help you stay ahead. Resilient Foundation encourages researchers to adopt these tools for impactful results.
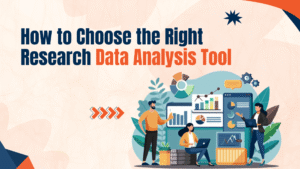
How to Choose the Right Research Data Analysis Tool
If you are new, choosing one tool can feel confusing. But if you follow some steps, you can select wisely. Good research data analysis tools should not just be popular; they should also match your project. Here are some factors:
- Type of Data: If you focus on numbers, data science training for research with R or SPSS will be more useful.
- Ease of Learning: Tools with data visualisation training support are easier for beginners.
- Project Needs: Excel works well for quick surveys. SPSS or R is better for deep quantitative data analysis training.
- Future Use: If you plan on pursuing advanced studies, investing time in data analysis using SPSS and R will give you long-term value.
So, if you take guidance from experts like Resilient Foundation, you can choose the tool that suits your research best.
Expert Opinion
Experts believe that researchers should not limit themselves to one platform. With research data analysis tools and proper data science training for research, you can grow skills faster. By adding data visualisation training and practising data analysis using SPSS and R, you prepare for advanced studies.
Benefits of Using Research Data Analysis Tools
When researchers adopt the right tools, they not only save time but also improve quality. Research data analysis tools have many benefits if combined with data science training for research. Below are some key advantages:
- Better Understanding: Complex datasets become easy to explain through data visualisation training charts.
- Accuracy: Advanced software improves results in quantitative data analysis training tasks.
- Time Efficiency: Automated features reduce manual work, so you get faster insights.
- Clear Presentation: With effective data visualisation, your audience understands findings easily.
- Flexibility: You can do both basic and advanced data analysis using SPSS and R.
- Skill Growth: Researchers who use these tools grow in confidence and career.
Moreover, Resilient Foundation offers programs that combine learning with practice, so researchers can get hands-on experience. If you want to make your research results strong and easy to understand, then learning these tools is the right path.