Doing research is not just about collecting data. You must know how to study it the right way. That’s why research data analysis is so important. It helps you find clear and true results. If your data is not used properly, your answers may be wrong. Because of that, it’s important to follow a strong research methodology. You can also use data analysis using SPSS and R to understand your numbers better. These tools make your work easier and more correct. If you want to improve your scientific research, learning from quantitative data analysis training will help you grow faster.
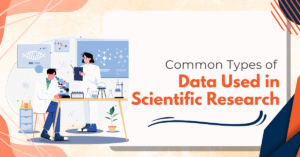
Common Types of Data Used in Scientific Research
To do great research, first you must know what kind of data you’re working with. So, there are many types of data, but here are the most common ones in scientific research:

- Quantitative Data: These are numbers, like test scores, temperature, or sales. This type of data is most used in statistical analysis in research.
- Qualitative Data: These are words or descriptions, such as interview responses or observations.
- Primary Data: This is data you collect from a survey or experiment.
- Secondary Data: This data comes from books, websites, or other studies; however, you don’t collect it yourself.
- Cross-sectional Data: Data collected at one point in time.
- Longitudinal Data: Data collected over a longer period.
Knowing these helps you select the right research methodology and apply better data analysis using SPSS and R. So, before starting any project, always decide what type of data suits your goals.
Best Tools and Software for Effective Research Data Analysis
You need good tools to study your data. These tools help you find accurate answers and save valuable time. So, here are the top tools researchers use for data analysis:

- SPSS: This tool is easy to use. It helps with numbers, graphs, and reports. You don’t need to know coding. That’s why data analysis using SPSS and R is very popular in schools and research centres.
- R: This is a free tool used by many experts. It is good for deep and strong statistical analysis in research. So, you can use it for big data and hard formulas.
- Power BI: It helps you show your data in pictures like charts and graphs. So, this makes it easy to share your scientific research with others.
So, if you use these tools along with the right research methodology, your quantitative data analysis training will become more useful.
Statistical Techniques That Improve Research Accuracy
Some easy methods can help make your data study more accurate. For example, these are the most common techniques used in research data analysis:
- Descriptive Statistics: It helps you summarise your data using mean, median, and mode.
- Regression Analysis: It helps you understand how two things are connected, like height and weight.
- Correlation Analysis: It measures how two variables are related.
- T-tests and ANOVA: These help you compare two or more groups to see if differences are real or just by chance.
- Chi-Square Test: Useful for examining the relationship between two categories.
These are useful in statistical analysis in research. So, if you learn them well in quantitative data analysis training, then your scientific research becomes clearer and exact.
Step-by-Step Process to Analyse Research Data Effectively
Doing research data analysis is easy if you follow these simple steps: So, here is a step-by-step process:
- Ask your main question: What do you want to know or prove?
- Pick a good research methodology: Choose how you will collect and study data.
- Collect your data: Use a form, test, or observation to get answers.
- Clean your data: Check for missing or wrong values and remove them.
- Use the right tools: Try data analysis using SPSS and R, or Power BI.
- Do your tests: Use good statistical analysis in research, like a t-test or regression.
- Read the results: Understand what your numbers are telling you.
- Show your results: Use simple words and pictures to explain what you found.
These steps are taught clearly in quantitative data analysis training; thus, they help you improve your scientific research fast.
Tips to Strengthen Accuracy in Scientific Research Through Data
To get the best results in your work, you can follow these tips. Because they will help you improve your research data analysis easily:
- Always use clean data: Wrong or missing data gives wrong answers.
- Learn good tools: Know how to use data analysis using SPSS and R.
- Be clear about your goal: This helps you choose the best research methodology.
- Check your work twice: Do the same test again to be sure of your results.
- Take expert training: Learn through the quantitative data analysis training at Resilient Foundation.
- Get help when stuck: Reach out to the Resilient Foundation for expert help in statistical analysis in research.
Resilient Foundation gives you easy training in data tools and steps. Because of that, many students and researchers improve their scientific research skills quickly. The team at Resilient Foundation makes learning simple, useful, and fun.

